Indoor heatmap of people locations
June 10, 2020
In these covid times, it's important to get an idea of a space's occupancy, such as a building or park. Can it take more people? Are there too many? How are they spaced within the space?
Challenges#
- privacy. no wants to advertise using the toilet
- (but maybe you want to know if there's room in the bathroom to use the toilet before going in the door)
Prior Art#
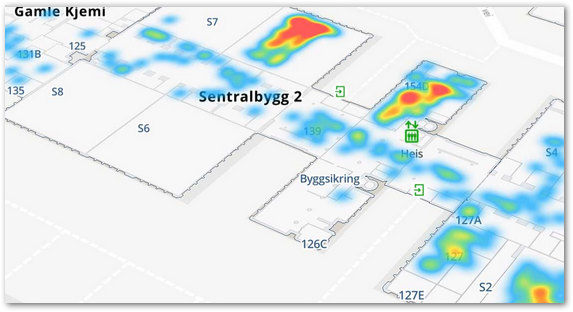
Mazemap#
Below is a live example of how you can visualize a large set of data points on top of the indoor maps. Using the built-in heatmap layer of the MazeMap JS API, it is easy to control the visualization style and what set of points you want to visualize.
JS API Example: Heatmap Data Layer
Go to the JS API example documentation →
"You need a source of the input data points. In this example we have a json file with GeoJSON formatted data points. You could also do periodic fetching of your own data and parse it to GeoJSON on the client."
From <https://api.mazemap.com/js/v2.0.0-beta.11/docs/#ex-heatmap>
So, getting the points is a homework exercise.
WRLD.js
Add a heatmap to an indoor map. Zoom in and out to view the heatmap at differing densities.
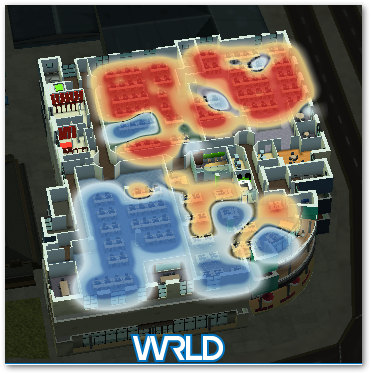
From <https://www.wrld3d.com/wrld.js/latest/docs/examples/adding-a-heatmap-indoors/>